Phosphorus decisions that match your soil
Good phosphorus management starts with understanding how strongly your soil binds P. The Phosphorus Buffering Index explains that binding strength. As PBI rises, the Colwell P needed for a crop response also rises. That is why two paddocks with the same Colwell can behave very differently. Use PBI to set the right Colwell target for your crop and soil type, then budget to lift or maintain accordingly.
Why topsoil depth matters
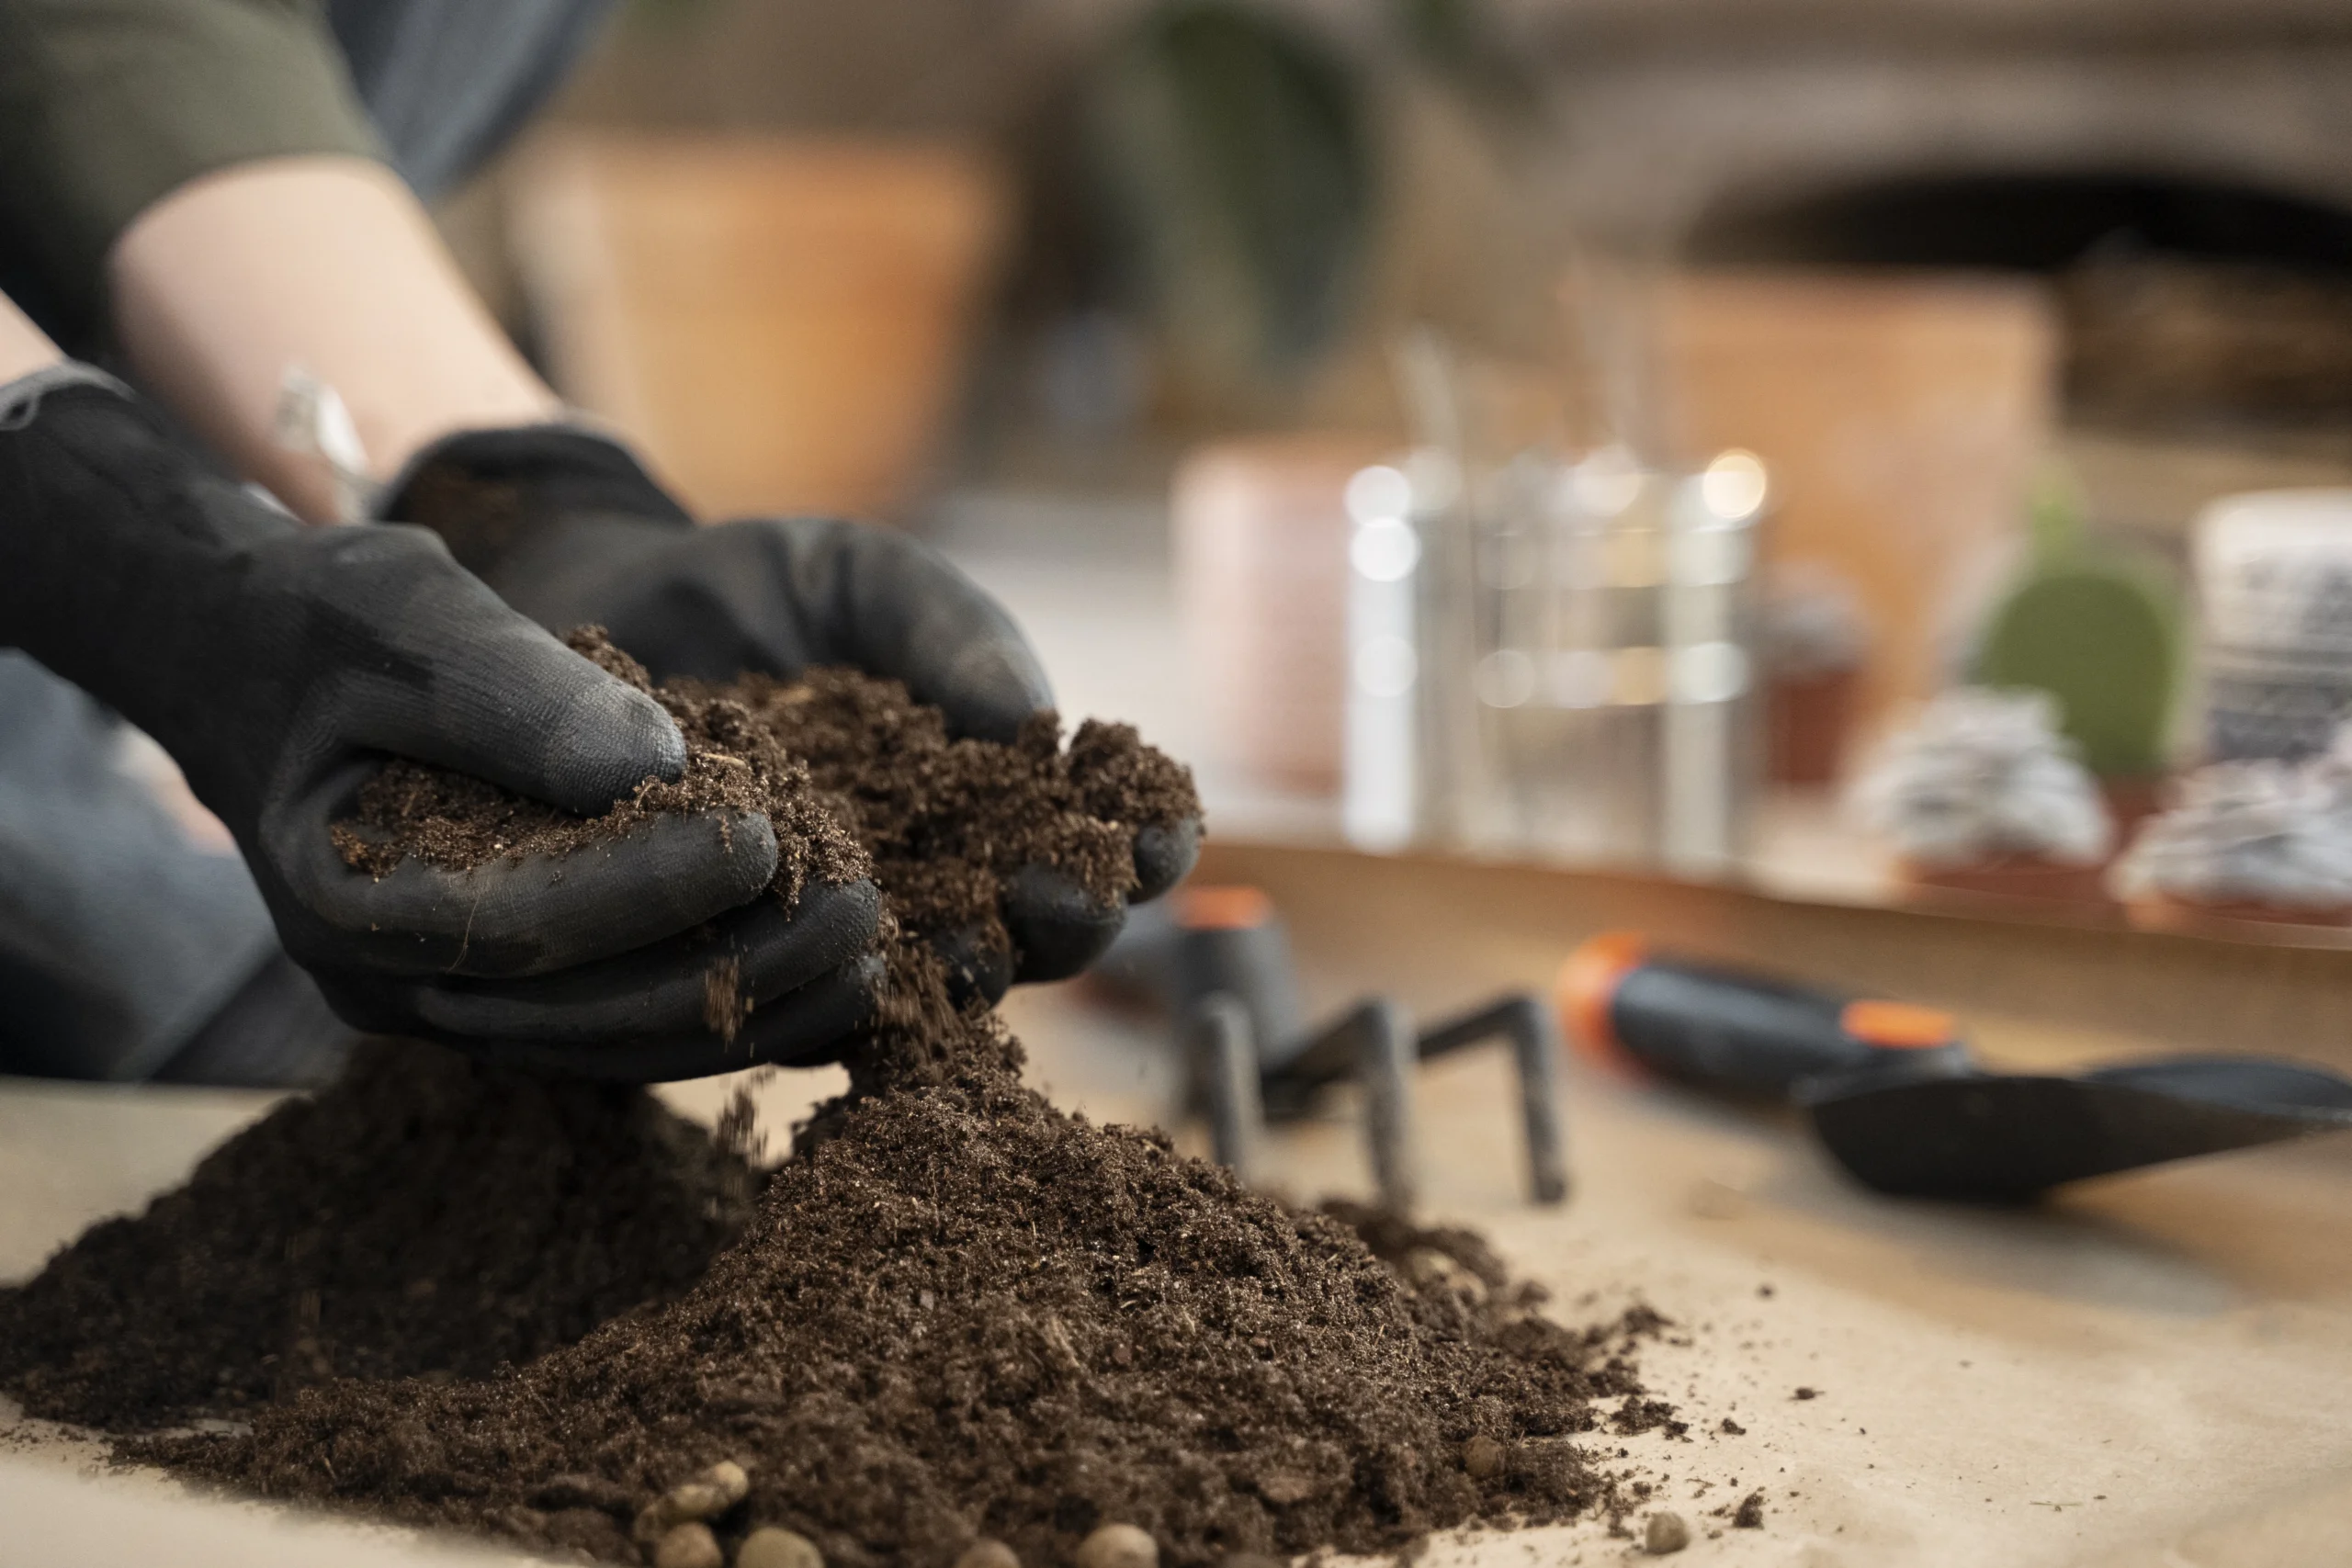
P is largely immobile. Sample 0 to 10 cm to reflect where P is placed and used by young roots. Stratification from surface applications is common, which makes consistent depth essential for year on year comparison.
How to read PBI without the guesswork
Think of PBI as the soil’s hunger for phosphorus.
- Low PBI soils bind little P. They need lower Colwell targets and respond quickly to applied P.
- Moderate PBI soils need moderate targets and reward steady maintenance applications.
- High PBI soils lock up more P. They require higher targets and benefit from strategic placement to put P where roots can find it.
Your Dawson Ag agronomist will match PBI bands to realistic Colwell targets for your crop sequence and rainfall zone.
Setting targets that fit your rotation
Target levels are not one size fits all. We set them against:
- Crop sensitivity and early P demand, for example canola and pulses versus cereals
- Expected yield range for the season
- Soil texture, organic carbon and pH which influence P availability
- Placement method at sowing and how accurately your bar places fertiliser near the seed
- Budget and payback period, balancing immediate response with long term lift
The outcome is a clear target band per paddock zone. High potential zones often justify a quicker lift. Lower potential zones suit maintenance first, then gradual build as returns allow.
Sampling that decision makers can trust
- Zones first. Split paddocks by soil type and potential rather than averaging everything together.
- Depth is non negotiable. Keep 0 to 10 cm consistent for Colwell P and PBI.
- Composite correctly. Aim for 15 to 20 cores per zone to reduce noise.
- Repeatable points. Log GPS so you can track movement toward the target over time.
- Handle well. Label samples clearly and freight to the lab promptly.
Turning lab numbers into a plan
- Sort zones by gap to target. Prioritise areas with the biggest shortfall or highest payback.
- Choose a strategy per zone. Maintenance if you are on target. Build if you are below target and the zone can return it.
- Pick the right product and placement. Quality MAP or DAP at sowing is the backbone for most grain systems in our region.
- Set rates for the season. Starter P at sowing for early vigour, plus extra in build zones to close the gap at a sensible pace.
- Review at harvest. Compare spend, yield and quality by zone to confirm the return.
Maintenance versus build programs
- Maintenance keeps you near the target while replacing removal. It suits zones already in the sweet spot.
- Build aims to lift Colwell P into the target band over several seasons. We stage increases to match cash flow, equipment limits and risk.
- Mixed programs are common. A single paddock may have maintenance on lighter rises and build on heavier, higher potential country.
Placement and timing for real response
- Band at sowing. Placing P near the seed or seedling roots improves early access in cool soils.
- Avoid seed burn. Use safe rates in-furrow for the crop and row spacing or offset fertiliser bands.
- Consider deep banding only where it matches a clear constraint and pays in your system. Most response for cereals is from starter P in the topsoil where roots first explore.
- Keep stubble cover where possible. It helps moisture, which helps roots find fertiliser bands sooner.
Variable rate that earns its keep
- Lift rates in zones below target where yield potential is strong.
- Hold or ease rates in zones at or above target where response is unlikely.
- Track removal with yield maps if available. This tightens maintenance rates and prevents slow drift below target.
Common pitfalls
- Chasing a whole paddock average. It hides both deficiency and waste.
- Inconsistent sampling depth. It breaks year to year comparisons.
- Mixing soil types in one composite. It blurs the true requirement.
- Expecting one heavy application to fix a high PBI soil. Building takes seasons.
- Skipping P in high N programs. Strong biomass without P support risks haying off and poor grain quality.
What good looks like
- Clear zone maps and repeatable sampling points
- Colwell P and PBI trended over seasons
- Starter P at sowing, with build where targets are not met
- Variable rate files aligned to zones and equipment
- A simple paddock sheet that logs soil tests, targets, applied rates, and harvest outcomes
Book a phosphorus review with Dawson Ag. We will test zones to the correct depth, confirm PBI and Colwell targets, and design a maintenance or build plan that suits your rotation and budget across Southern QLD and Northern NSW.