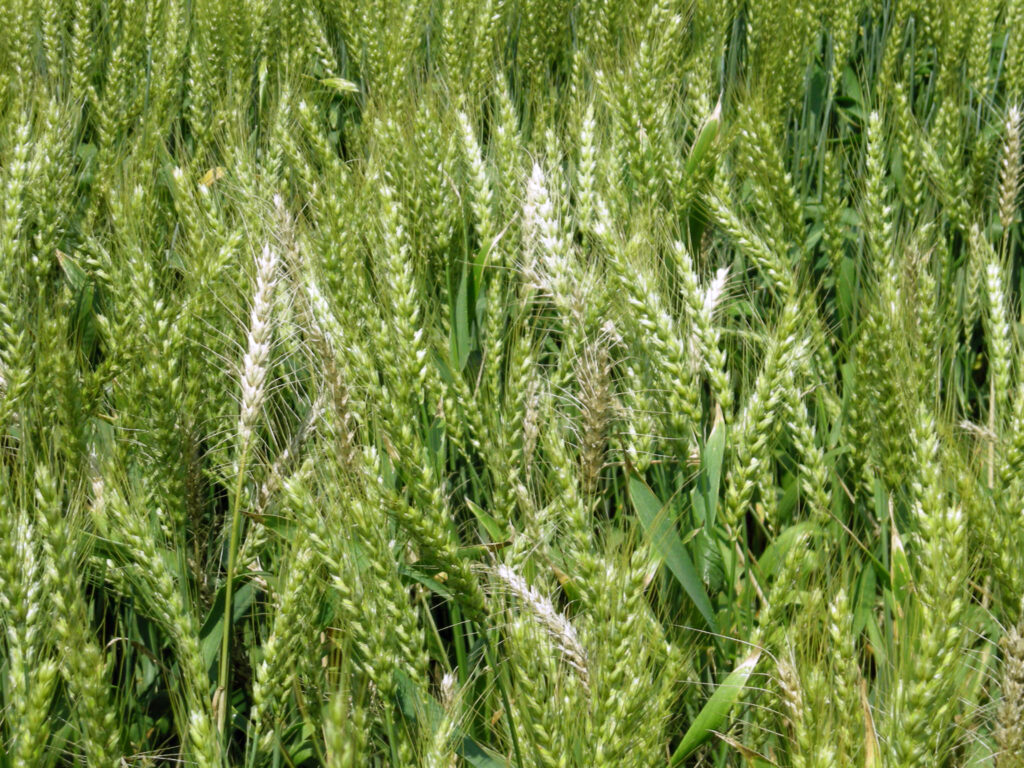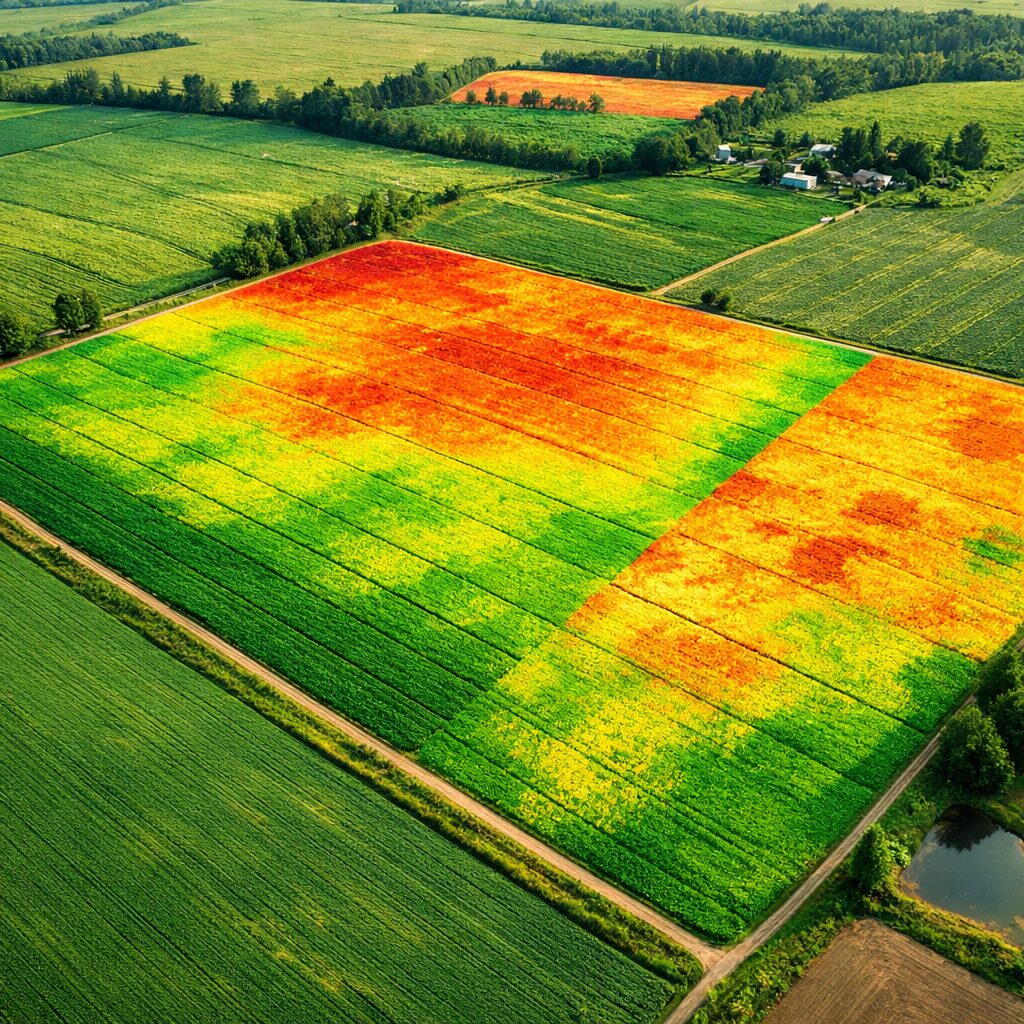
Modern farming increasingly relies on data, and one of the most valuable data tools is the Normalised Difference Vegetation Index (NDVI). NDVI is a remote-sensing index derived from satellite or drone imagery that compares how much near-infrared light plants reflect versus how much visible light they absorb[1]. Healthy plants reflect strongly in the near-infrared spectrum and absorb visible light for photosynthesis; stressed plants reflect less. The result is a simple numerical scale where higher values indicate vigorous, thriving crops and lower values signal stress due to pests, water scarcity or nutrient deficiencies[2].
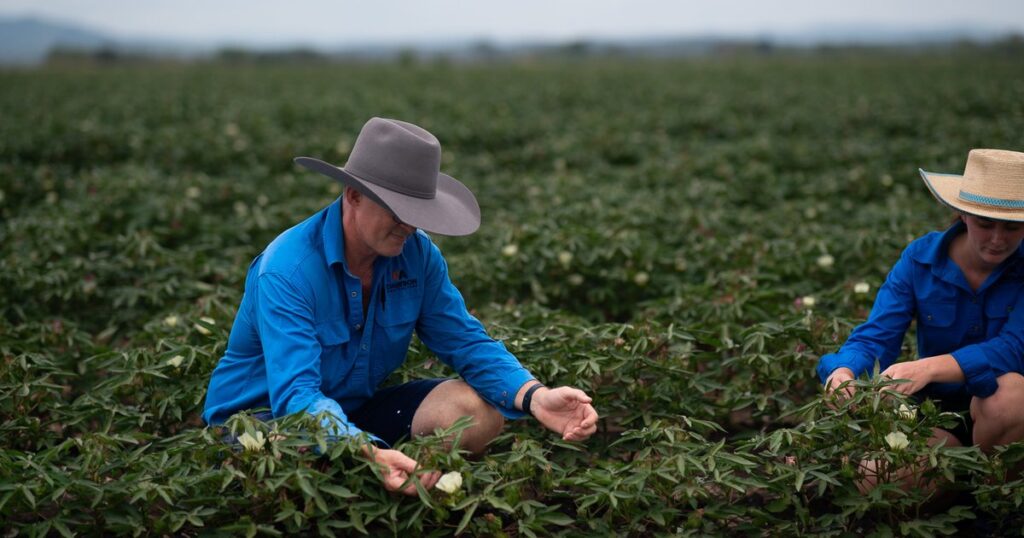
Because NDVI values are mapped across an entire field, farmers gain a bird’s-eye view of their crops. This bird’s-eye perspective can reveal problem areas that might otherwise go unnoticed from the ground. For example, a low-NDVI patch may indicate a fertiliser deficiency or insect damage, prompting a targeted inspection and intervention[3]. By identifying issues early, NDVI allows growers to respond before minor stresses become yield-reducing problems.
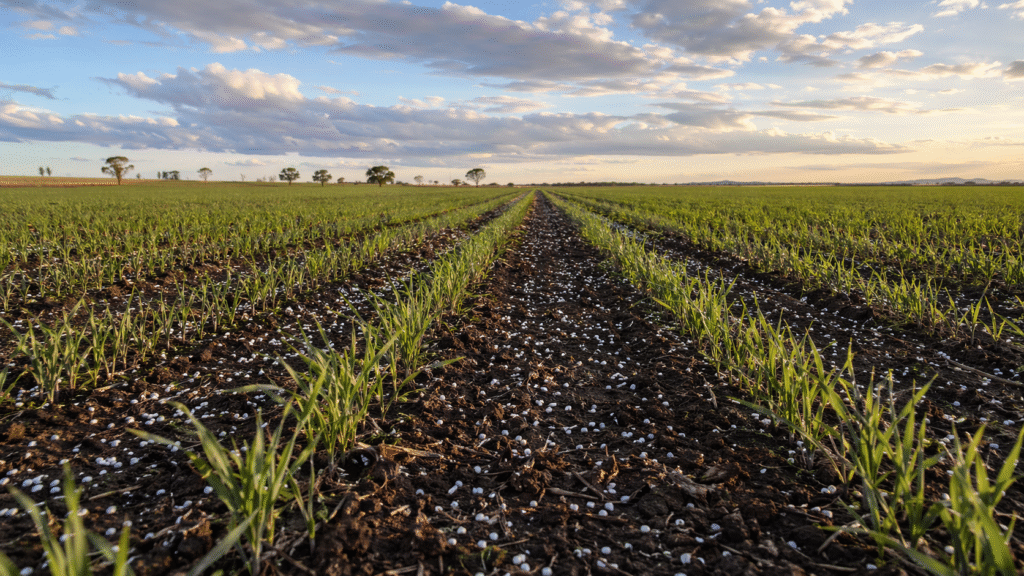
NDVI is not just about monitoring; it forms the backbone of variable-rate applications (VRA). Once NDVI data highlights areas of concern, VRA technology adjusts fertiliser, pesticide or irrigation rates to match the specific needs of each zone. Instead of treating an entire paddock uniformly, farmers can apply exactly what each area requires, reducing waste and lowering input costs[4]. This targeted approach improves yields by giving crops the best conditions to thrive and promotes environmental sustainability by preventing over-application and nutrient runoff[5].
NDVI data can be collected using a variety of platforms, from freely available satellite imagery to high-resolution drone surveys. Sophisticated yet user-friendly software platforms convert imagery into NDVI maps and generate VRA prescriptions for compatible equipment. As NDVI is combined with soil testing and electromagnetic surveys, the resulting multi-layered maps enable even more precise management decisions.
In essence, NDVI takes the guesswork out of crop monitoring. This simple index translates light measurements into actionable insights, empowering farmers to detect stress early, allocate resources efficiently and maximise both yields and sustainability. For growers looking to step into precision agriculture, understanding and leveraging NDVI is an accessible and powerful starting point.
References
- [1] [2] [3] [4] [5] Unlocking the Power of Precision Agriculture: Crop Health Monitoring, NDVI, and Variable Rate Applications https://www.fieldbee.com/blog/unlocking-the-power-of-precision-agriculture-crop-health-monitoring-ndvi-and-variable-rate-applications