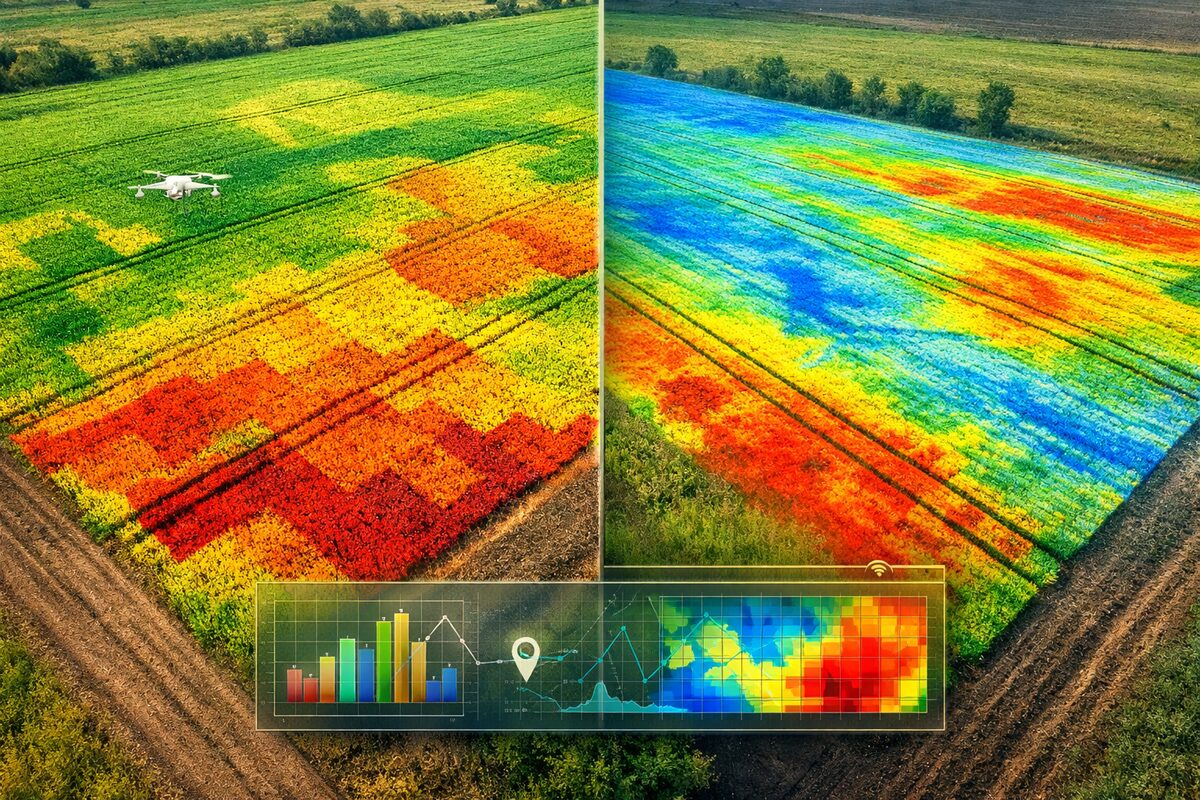
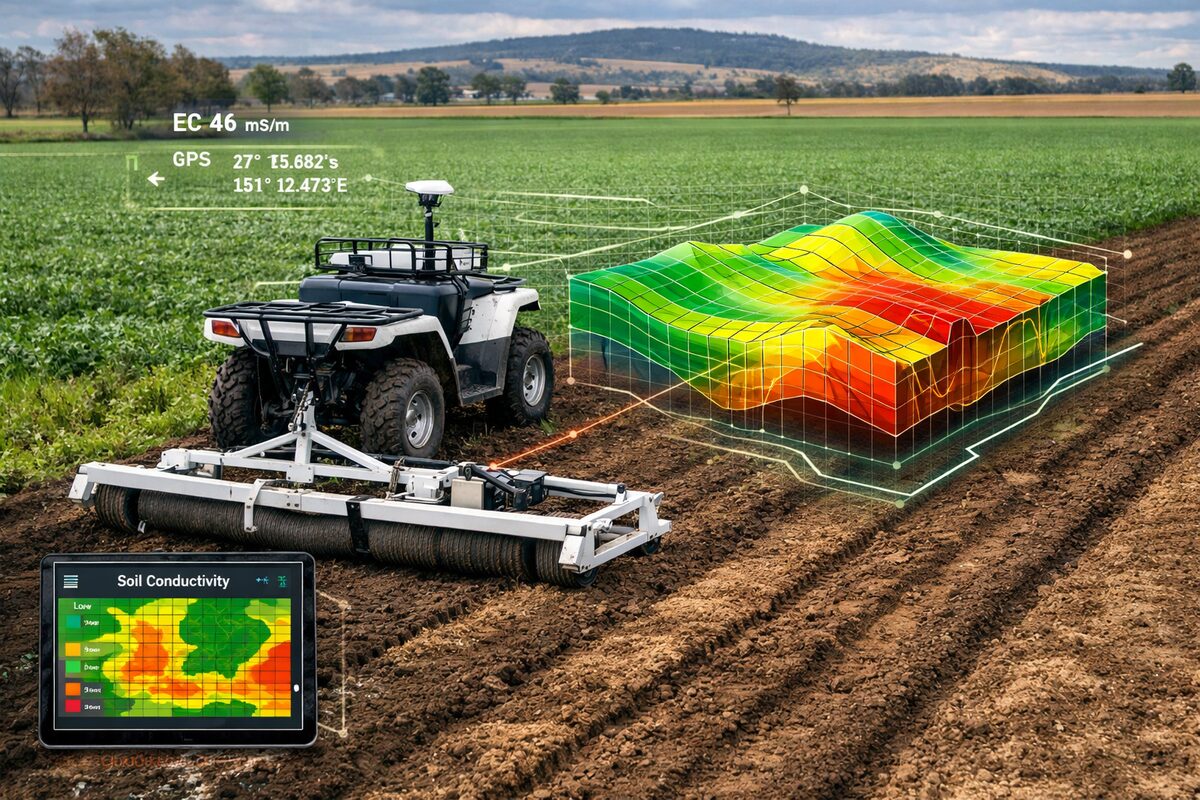
A standard soil test samples the top 0-15 cm. That surface layer matters, but it does not tell you what’s left deeper in the profile. In many paddocks, significant amounts of residual nitrogen sit between 30 and 90 cm down. Deep soil testing measures it, so the next fertiliser decision is based on what the soil actually has, not on a rate-of-thumb.
The case for deep testing has been around for decades, but it gets sharper when input costs rise. Urea prices have been volatile through 2025-26 on the back of global supply disruption (the Strait of Hormuz closure earlier this year is the most recent example, with several major producers offline). When the input is expensive, you cannot afford to apply nitrogen the soil already has.
The argument is straightforward. If a deep core finds 80 kg/ha of mineral N already in the profile, that’s 80 kg/ha you don’t have to buy as urea. At broadacre scale, across hundreds or thousands of hectares, that adds up to a number worth knowing before you write the fertiliser order.
How deep, and how often
For most cropping situations in southern Queensland and northern NSW, sampling needs to go to 0-60 cm for wheat and oats and 0-90 cm for sorghum, canola, barley, and cotton. The deeper crops have root systems that draw on residual N well below the topsoil, so a 0-30 cm test alone misses what they will actually use.
Annual testing pre-plant is the right cadence. Residual nitrogen varies year to year depending on rainfall, in-crop uptake, mineralisation, and what the previous crop pulled out. A test from two years ago is not the same paddock today.
Avoiding the over-application trap
Without deep data, the safer-sounding choice is often to apply at the standard book rate “just in case”. The trap is that this either wastes nitrogen the soil already had, or pushes excess vegetative growth in cereals, which can hurt grain quality and lodging risk. Knowing what’s there pre-plant lets you fertilise to the actual gap, not to a generic rate.
Where the savings come from
The dollar-per-hectare saving depends on three things: how much residual N is actually in the profile, the urea price on the day, and the area being fertilised. We don’t quote a generic figure here because making one up across all situations is misleading. What we will tell you is that on most paddocks we sample, deep testing pays for itself in the first season the data is used.
If you want a numbers conversation against your own paddock data, get in touch through the contact page.