The challenge of variability
When fertiliser prices rise, guesswork becomes expensive. Two paddocks with identical soil types can produce very different yields because of subtle variations in nutrients, moisture and crop health. Normalized Difference Vegetation Index (NDVI) and electromagnetic (EM) surveys are complementary tools that allow growers to map this variability and fine-tune input rates. NDVI measures plant vitality from above, while EM measures soil properties from below. Using both can create nutrient management plans that save money and boost yields.
NDVI: a bird’s-eye view of plant health
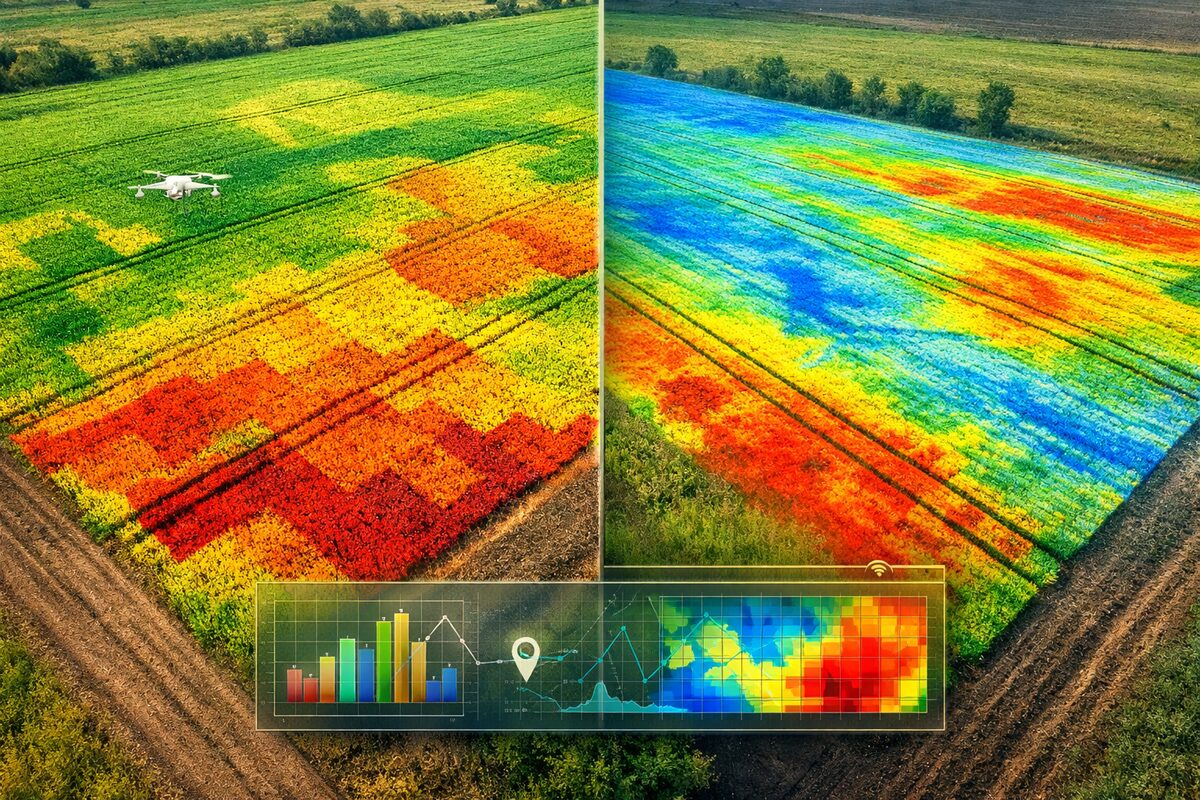
NDVI is a remote-sensing index derived from satellite or drone imagery. FieldBee explains that NDVI measures the difference between near-infrared light, which healthy plants strongly reflect, and visible light, which plants absorb[1]. The result is a scale on which higher NDVI values indicate healthy, thriving crops, while lower values suggest stress from pests, water shortages or nutrient deficiencies[1]. Because NDVI imagery provides a bird’s-eye view of fields, it can reveal problem areas before they become visible on the ground[2].
Once NDVI pinpoints zones of differing crop health, the next step is to act on that information. Variable Rate Application (VRA) technology allows growers to apply inputs – fertiliser, pesticides or water – at rates tailored to each zone. According to FieldBee, VRA optimises input use, improves yields and promotes environmental sustainability by minimising over-application[3][4]. In practice, NDVI data are processed through software to create VRA maps, which guide tractors and spreaders to apply more fertiliser where it’s needed and less where it isn’t.
EM data: understanding soil variability
While NDVI tells you how crops are performing, EM data explain why. Ground-based EM surveys measure the soil’s apparent electrical conductivity, which is influenced by moisture, clay content and salinity[5]. Optisoil notes that high EM readings indicate wetter or more clay-rich areas, while low readings correspond to sandy, drier soils[6]. This information helps growers distinguish between zones where poor NDVI results from dry, sandy soil versus zones where low NDVI might be due to nutrient deficiency.
Creating zones with NDVI and EM
Combining NDVI and EM data enables more precise zone management. Dawson Agriculture describes three tiers of soil testing: a standard test with five cores per paddock, zonal testing based on NDVI or EM data, and comprehensive testing following an EM survey[7]. In zonal testing, NDVI imagery or EM maps are used to define distinct zones within a paddock, which are then sampled individually. This accounts for the variation across the field and allows variable-rate fertiliser plans to target specific needs[7].
For example, a paddock may have areas with low NDVI and low EM – signalling sandy, drought-prone patches. Another zone might have high EM but low NDVI, indicating a heavier, waterlogged soil. By integrating both datasets, farmers can decide where to adjust irrigation, apply gypsum or add nitrogen. The result is a more efficient fertiliser strategy that responds to the underlying causes of variability rather than treating symptoms alone.
Integrating technology on the ground
Modern tractors and implements increasingly incorporate sensors and connectivity. Sensors mounted on tractors can measure soil moisture, crop height and chlorophyll levels in real time, feeding back into NDVI-based VRA maps and EM data layers. FieldBee notes that such sensor-equipped tractors provide real-time data, improve efficiency and enhance decision-making[8]. When NDVI imagery, EM maps and live sensor data are combined, farmers can make adjustments on the go – changing fertiliser rates mid-pass or scheduling irrigation based on soil moisture readings.
The payoff
Integrating NDVI and EM data transforms fertiliser management from a reactive to a proactive process. NDVI pinpoints crop stress; EM explains soil variability; together they enable zone-specific sampling, variable-rate applications and dynamic adjustments during field operations. This approach not only reduces fertiliser waste and input costs but also protects soil health and improves yields. For growers facing high fertiliser prices, harnessing NDVI and EM data represents a smart investment in precision agriculture.
References
- [1] [2] [3] [4] [8] Unlocking the Power of Precision Agriculture: Crop Health Monitoring, NDVI, and Variable Rate Applications https://www.fieldbee.com/blog/unlocking-the-power-of-precision-agriculture-crop-health-monitoring-ndvi-and-variable-rate-applications
- [5] Using ground-based EM and radiometrics to map soil amelioration | GroundCover https://groundcover.grdc.com.au/agronomy/soil-and-nutrition/using-ground-based-em-and-radiometrics-to-map-soil-amelioration
- [6] Precision Soil Mapping: Combining EM Induction, Gamma Radiometrics and Machine Learning https://www.optisoil.com.au/news/details/better-soil-decisions-with-em-gamma-and-machine-learning
- [7] Top #1 soil testing firm in QLD | Dawson Agriculture https://www.dawsonag.co/soil-testing-queensland/