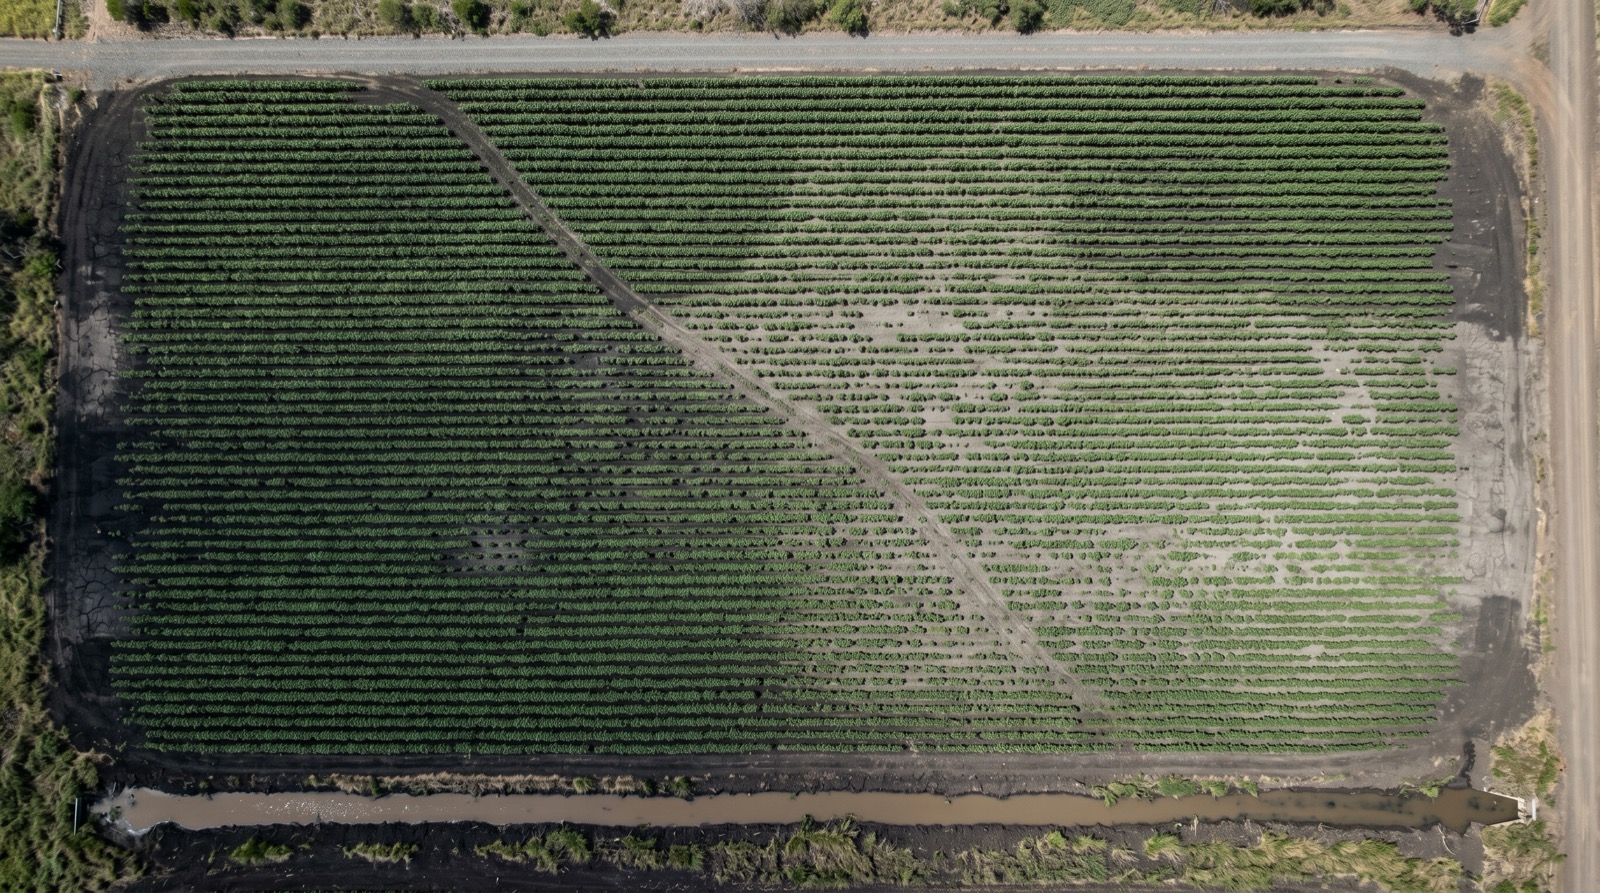
Walk a 200-hectare irrigated cotton paddock on the Darling Downs or in the Border Rivers and the variability is obvious before you reach the second siphon. Heavy grey clay in the lower thirds, lighter rises with sodic subsoils, an old fence line where organic matter sits higher than the rest of the field. A blanket nitrogen rate across that paddock either feeds the worst country at the cost of the best, or pushes lint on the better soils while the weaker zones lodge, leach, or simply sit. Variable-rate fertiliser for cotton is the tool that addresses this mismatch. The question for cotton growers in 2026 is not whether VRT works, it is whether the data layers underneath your map are good enough to trust. We work with experienced cotton agronomists across QLD and NSW on exactly this problem, and the honest answer is that the prerequisites matter more than the spreader.
What VRT actually means for cotton
Variable-rate technology means applying a different rate of an input (nitrogen, phosphorus, gypsum, lime, seed) to different parts of a paddock based on a prescription map. The map is built from soil and crop data layers that describe how the paddock varies. A controller on the spreader, planter, or fertigation system reads the map by GPS and adjusts the rate on the fly. In cotton, the input most often varied is nitrogen, because N drives both yield and lint quality, and because cotton’s N demand changes sharply with soil type, water-holding capacity, and in-season biomass.
Why grains-led VRT research translates (and where it does not)
Most of the published Australian VRT science has come out of grains. Wheat, barley, sorghum, and canola have been the test beds for zone delineation, deep N sampling, NDVI-driven rescue applications, and prescription map building. The good news is that the underlying logic transfers directly to cotton. Soils vary. Yield potential varies with soils. Nitrogen response is non-linear, so a uniform rate will always be wrong on at least part of the paddock.
Where it stops translating is in the agronomy. Cotton is a perennial crop grown as an annual, indeterminate, with a fruiting pattern that responds to nitrogen for far longer than a winter cereal. Excess N in cotton causes rank growth, delayed cut-out, regrowth at picking, and trash penalties. Grain crops penalise you with protein swings or lodging. Cotton penalises you commercially. That changes the cost of getting VRT wrong on the high end, and it changes how aggressive you can be with rate spread across zones.
Irrigation also changes the picture. Furrow, bankless, and overhead systems each move water (and nitrate) differently across a field. A VRT map built off soil texture alone, without accounting for how water actually distributes, will mis-rate the head ditch end versus the tail end of the field every time.
The GRDC/SPAA project in context
Jeremy Dawson holds an active GRDC/SPAA research contract under the Precision Fertiliser Decisions in a Tight Economic Climate project (SPA2201-001SAX), funded by the Grains Research and Development Corporation in partnership with the Society of Precision Agriculture Australia[1]. The project documents how Australian grain producers across multiple regions are using variable-rate fertiliser strategies on broadacre paddocks, with a particular focus on the economics of precision nitrogen decisions when input costs are high[1].
The reason this matters for cotton growers, even though the project sits inside a grains research portfolio, is simple. The decision-making framework is the same. You map variability. You ground-truth it with soil data. You write a prescription that ties rate to expected response, not to gut feel. You measure what came off. The crops differ, but the discipline is identical, and the lessons travel. We are not in a position to disclose project findings ahead of GRDC’s own communications, and we will not. What we can say is that participating in this work keeps the agronomy in front of the technology, which is the right way around.
Soil variability mapping prerequisites
VRT without good data layers is just expensive uniform application with extra steps. Three layers do most of the work for cotton.
Electromagnetic (EM) surveys. An EM38 or DualEM run gives you apparent electrical conductivity (ECa) at depth, which correlates with clay content, salinity, and water-holding capacity. On a flood-irrigated cotton field, ECa often picks up the boundary between the heavier bottom country and the lighter rises before any visual cue does. EM is the foundation layer because it reflects soil properties that do not change year to year.
NDVI imagery. Multi-year NDVI from satellite (Sentinel-2 at 10 m, or higher-resolution providers) shows where the crop has actually performed across seasons. One year of NDVI is a snapshot. Five years of NDVI is a yield-potential map, and it does not lie about parts of the paddock the grower has been carrying for sentimental reasons.
Zonal soil testing. Once EM and NDVI agree on where the zones are, you sample inside each zone to depth, 0-30, 30-60, 60-90 cm at minimum. Cotton roots a long way down, and residual nitrate at depth is the single most over-applied nutrient in the industry. Without zonal sampling you cannot write an honest prescription, you can only write a guess. We use independent soil testing as the third leg of the stool, totally independent of any fertiliser, seed, or chemical reseller.
Building variable-rate fertiliser maps for cotton: a practical workflow
This is the sequence we walk clients through, in order. Skipping a step does not save time, it loads the error in elsewhere.
- Run an EM survey on the paddock once, and keep it. Costs scale with hectares but it is a one-time investment for the life of the field.
- Pull 3-5 years of historical NDVI at peak biomass for the rotation, not just cotton seasons. Sorghum and wheat NDVI tell you about the same soil.
- Delineate 2-4 management zones by overlaying EM and NDVI. More than four zones is usually false precision on cotton paddocks.
- Sample each zone to 90 cm for nitrate, phosphorus, sulphur, and the constraint package (ESP, EC, chloride). Cotton on sodic subsoils will not respond to extra N.
- Set zone yield targets based on the historical NDVI, not on the paddock average. The high zone gets a higher target, the low zone gets a realistic one.
- Calculate N requirement per zone using a cotton N factor of 25 kg N per bale of yield target, less soil nitrate, less mineralisation.
- Write the prescription with a sensible rate spread. We rarely take cotton prescriptions outside a 0.6x to 1.4x band around the paddock mean, because rank growth risk is real.
- Measure the result with yield monitor data or NDVI at cut-out. Without that loop, next year’s map is built on the same assumptions as this one.
ROI: when VRT pays back in cotton, and when it does not
Honest answer first. VRT pays best on paddocks with high spatial variability, high input costs, and a grower willing to act on the data. It pays poorly on uniform paddocks, on operations where the prescription gets overridden in the cab, and on fields where the underlying soil constraints (sodicity, compaction, waterlogging) are limiting yield more than nitrogen ever could.
For irrigated cotton specifically, the strongest payback usually comes from rate reduction on the worst zones, not from rate increase on the best. Pulling 30-50 kg N/ha out of low-yielding country that was never going to use it is money straight back to the grower, and it cuts rank-growth risk at the same time. Increasing rate on the best zones is a smaller, less reliable gain because cotton’s response curve flattens fast at the top end.
Set-up costs (EM, multi-year imagery, zonal soil testing, prescription writing) typically run to several thousand dollars per paddock in year one, then drop sharply in subsequent years because the EM and the zone delineation carry forward. Whether that pays back depends entirely on the variability you started with. We will tell you up front if a paddock is too uniform to bother. That is part of being totally independent.
What is next in cotton precision agronomy
The GRDC/SPAA contract Jeremy holds runs across the next two seasons, and the cotton-specific precision work we are doing alongside it (on client paddocks, not as part of the funded grains study) will continue to feed back into how we write prescriptions for irrigated cotton. Expect more on real-time NDVI for in-season N decisions, on integrating soil moisture probes into prescription logic, and on how to cost-out VRT against blanket application transparently. None of that work is finished, so none of it will appear here as a claim until it is.
If you are a cotton grower in Southern Queensland or Northern NSW thinking about VRT for the 2026/27 season, the right move is to get the data layers organised now, not in October. EM in winter, soil sampling before the pre-irrigation, prescription written in time for the planting nitrogen pass.
Talk to an agronomist who actually does this work
Dawson Agriculture runs experienced cotton agronomists across QLD and NSW, with 25+ years in Southern Queensland and Northern NSW paddocks and active research participation in precision fertiliser decisions through the GRDC/SPAA project. We are totally independent, no chemical, seed, or fertiliser company sitting on our shoulder when we write your prescription.
See how we are applying precision learnings to cotton
References
- [1] GRDC/SPAA Precision Fertiliser Decisions in a Tight Economic Climate (SPA2201-001SAX) https://www.spaa.com.au/members-spaa/grdc-spaa-precision-fertiliser-decisions/
- [2] CottonInfo – Australian Cotton Production Manual (Cotton Research and Development Corporation) https://www.cottoninfo.com.au/
- [3] Improving nitrogen use efficiency in irrigated cotton production, Nutrient Cycling in Agroecosystems https://link.springer.com/article/10.1007/s10705-022-10204-6
- [4] Integrating NDVI and agronomic data to optimize the variable-rate nitrogen fertilization, Precision Agriculture https://link.springer.com/article/10.1007/s11119-024-10185-2